Wisdom for Investing
In client review meetings this year, we're spending some time discussing the strong results that bonds (fixed income) have produced in the past year while simultaneously acknowledging that inflation continues to be a drag on consumers worldwide. On the one hand, it is nice to get a return of between 6% and 8% from fixed income, particularly when they are much less volatile than stocks.
On the other hand, bonds have historically barely kept up with long-term inflation rates, and in many cases have had negative returns when accounting for inflation. So, when doing financial planning, we have to be extremely careful that we maintain your purchasing power over the course of your life. That often requires owning companies (stocks), as the below chart illustrates.
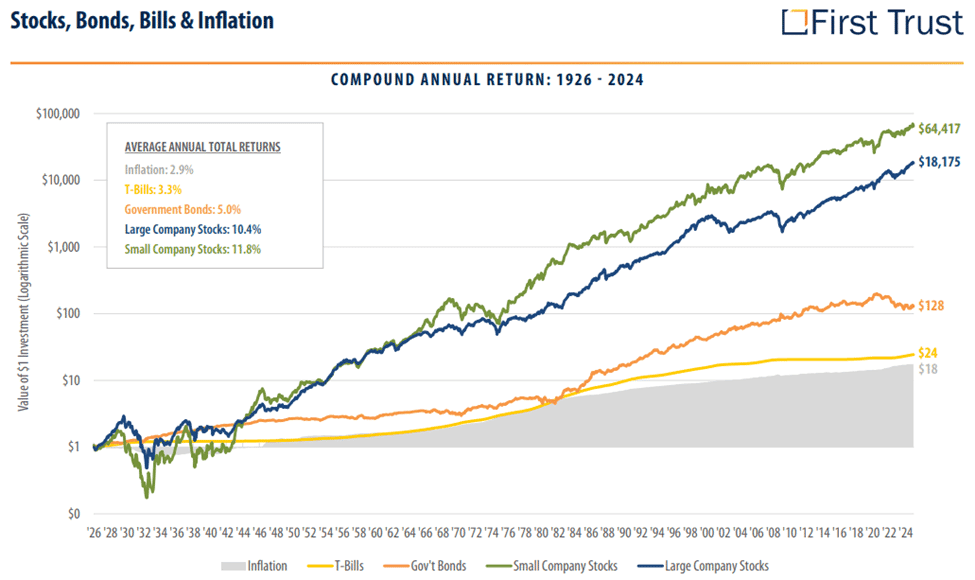
Source: First Trust, Ibbotson Associates. Hypothetical growth of a $1 investment made on 12/31/1925. Data is monthly and shows total returns through 12/31/2024. Past performance is no guarantee of future results. This chart is for illustrative purposes only and not indicative of any actual investment. These returns were the result of certain market factors and events which may not be repeated in the future. Inflation is represented by the Consumer Price Index (CPI-U) which measures the average change in prices over time that consumers pay for a basket of goods and services. Treasury Bills (T-Bills) are represented by the 30-day U.S. Treasury bill. Government Bonds are represented by the 20-year U.S. Government bond. Small Company Stocks (Ibbotson Small Company Stocks Index) are represented by the fifth capitalization quintile of stocks on the NYSE from 1926 to 1981 and the performance of the Dimensional Fund Advisors (DFA) Micro Cap Fund thereafter. Large Company Stocks (Ibbotson Large Company Stocks Index)are represented by the S&P 500 Composite Index (S&P 500 Index - an index of 500 companies used to measure large-cap U.S. stock market performance) from 1957 to present, and the S&P 90 from 1926 to 1956. Indexes are unmanaged and investors cannot invest directly in an index. Index returns do not reflect any fees, expenses, or sales charges. The asset classes shown here offer different characteristics in terms of income, tax treatment, capital appreciation and risk. U.S. government securities are subject to interest rate risk but generally do not involve the credit risks associated with investments in other types of debt securities. As a result, the yields available from U.S. government securities are generally lower than the yields available from other debt securities. Common stocks are subject to risks, such as an economic recession and the possible deterioration of either the financial condition of the issuers of the equity securities or the general condition of the stock market. The information presented is not intended to constitute an investment recommendation for, or advice to, any specific person. By providing this information, First Trust is not undertaking to give advice in any fiduciary capacity within the meaning of ERISA, the Internal Revenue Code or any other regulatory framework. Financial professionals are responsible for evaluating investment risks independently and for exercising independent judgment in determining whether investments are appropriate for their clients.
• $1 invested in 1926 would have grown to $24 in 2024 if it had been invested in a money market fund the entire time.
• $1 would have grown to $18 at the annual inflation rate over that 98 year period, so as stated above, you barely maintained your living standard over that time period.
• Alternatively, $1 grew to: $18,175 being invested in large US companies and $64,417 being invested in small US companies.
• Source: First Trust, as of 12/31/2024.
Two additional thoughts on inflation:
While the above data is the foundation for our views on planning for your long-term purchasing power, here are some additional thoughts on the topic:
Technology has historically been disinflationary. Meaning, as technology progresses, prices (in certain categories) get pushed down.
Example: 25 years ago, the average television sold for between $500 and $700. Today, you can still get a TV for that price range, except it will be significantly larger, significantly higher resolution, and most likely have built in computing power so that it can access online applications. In summation, a significantly better product for the same price.

Another example: the original iPhone retailed for $499 in 2007. Adjusted for inflation, that is around $775 in 2025. As you may be aware, you cannot get an iPhone 17 pro for $775 today. Instead, it costs $1,099 for the base model, a 42% cumulative increase.
A 42% cumulative increase is noteworthy, but less so when you consider that it is estimated that the iPhone 17 lineup is 500 times more powerful than the original iPhone. (Source: TechRadar) Put differently, the overall value that the device delivers has grown significantly faster than its price tag.
The rate of inflation experienced by retirees is different than other parts of the population. Meaning, most 80-year-olds do not travel as much as the average 50-year-old, so travel and leisure inflation rates have less of an impact on older individuals.
Per J.P. Morgan, health care spending accounts for 16% of spending for individuals over the age 75. Over the past 40+ years through 2024, health care inflation has averaged 4.5% growth per year.
Meaning, a medical expense that costs $5,000 today would cost $12,050 in 20 years. This is a prime example of what we're safeguarding against when we're constructing your investment portfolio to finance your spending through the entirety of your retirement.
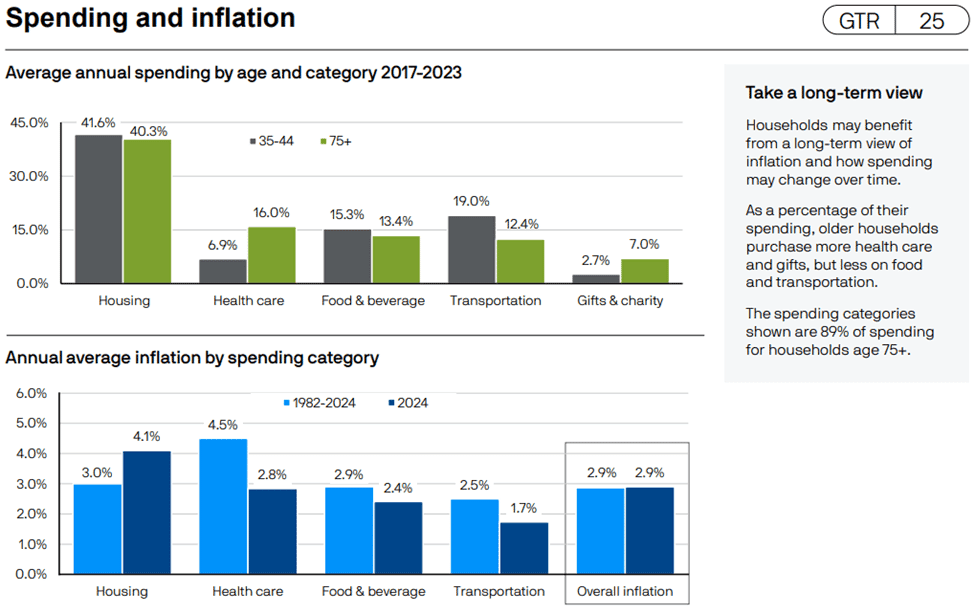
Source: JP Morgan Asset Management, as of 12/31/2024.
Thanks for reading,
Jack O'Connor, CFP®